Right menu

Featured resource


Media > TDT > Statistics > S_CM_M3_TA2_fig2
S_CM_M3_TA2_fig2

« 
Previous image
|
|
Next image
 »

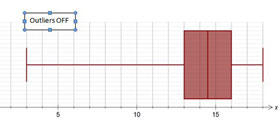
Box plot, extreme value included on left, with connecting whisker.

Produced with outlier function 'off'.

Related content