• print-friendly
  • Share


  • Home
  • Membership
    • Affiliates
  • News
    • Newsletters
    • e-news bulletins
  • Communities
    • DImensions
    • Discussion list
    • Guidelines
  • Better teaching
  • resolve
  • Library
    • Sample articles
    • TDT Readings
      • Fractions
      • Mental computation
      • Patterns
      • Reasoning
      • Statistics
    • Conference proceedings
    • Hanna Neumann lectures
    • Projects
      • Previous projects
    • Submissions
    • Media releases
    • Videos
      • Keynotes 2017
      • Keynotes 2015
      • Other videos
    • Other
  • Journals
    • Subscriptions
    • Submissions
    • Sample articles
    • Journals Index
    • Advertising rates
  • Webshop
  • Events
    • Subscribe calendar
  • Webinars 2020
    • Upcoming Webinars
    • Past Webinars
  • Student activities
    • NLNW
      • 2016
    • National Maths Day
      • National Maths Day 2015
      • National Maths Day 2014
      • National Maths Day 2013
      • National Maths Day 2012
      • National Maths Day 2011
    • NMSS
    • NMTQ
      • NMTQ 2017
    • Reach for the Stars
  • About AAMT
    • AAMT brochure
    • Constitution
    • Strategic plan
    • Annual reports
    • Position statements
      • Assessment
      • Attitudes
      • Australian Curriculum
      • Consumer and Financial Literacy

      • Right menu

        View Basket View basket: 0 items

        Media > TDT > Statistics > S_CM_M4_E3_fig5
        S_CM_M4_E3_fig5

        « 
        Previous image
        |
        Statistics
        |
        Next image
         »

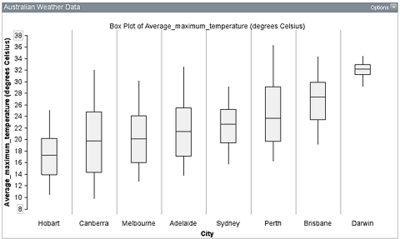
        The second plot transformed vertically and ordered from smallest to largest medians beginning at the left.

        Average monthly maximum temperature for 56 years.

        Related content

        Five bars of roughly correct relative height showing amounts $223, $59, $193, $44, $161. The $193 bar is twice as wide as others.

        S_CM_M2_E2_...

        Two dot plots with very similar shapes, ranging from near 0 mm to about 150 mm for September, and from near 0 mm about 218 mm for January, the central part of each plot between about 30 mm and 75 mm.

        S_CM_M4_E1_...

        Two dot plots, values for September spread from about 12 mm to 114 mm but more values less than about 77 mm, values for January positively skewed from 0 mm to about 62 mm.

        S_CM_M4_E1_...

        Two dot plots, all values for September spread fairly evenly from 10 mm to 170 mm, most data for January bunched at less than 30 mm with 4 values between about 46 mm and 102 mm.

        S_CM_M4_E1_...

        Two dot plots, all data for September bunched near 0 mm, data for January spread fairly evenly from about 130 mm to 940 mm.

        S_CM_M4_E1_...

        Box plots showing rainfall for Australian capital cities, ordered top down from largest to smallest medians. Order is Sydney, Brisbane, Darwin, Perth, Canberra, Melbourne, Hobart and Adelaide.

        S_CM_M4_E3_...

        Box plots showing temperatures for Australian capital cities over 56 years, ordered top down from largest to smallest medians. Order is Darwin, Brisbane, Perth, Sydney, Adelaide, Melbourne, Canberra and Hobart.

        S_CM_M4_E3_...


  • [home]
  • [copyright]
  • [disclaimer]
  • [privacy]
  • [sitemap]
  • [contact]
e news Twitter Facebook

©AAMT Inc.