print-friendly
Share
Right menu
View basket: 0 items
S_GT_T3_E2_fig1
«
Previous image
|
Statistics
|
Next image
»
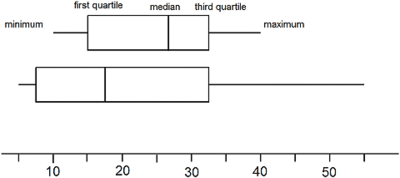
Structure of a box plot.
Related content
S_GT_T2_E2_...
S_GT_T2_E2_...
S_GT_T1_E2_...
S_GT_T3_E4_...
S_GT_T3_E4_...
S_GT_T3_E4_...
S_GT_T3_E4_...