Home > Student activities > National Maths Day > National Maths Day 2013 > Lower primary activities > About our world: Weather, food and culture
About our world: Weather, food and culture
What do you know about the weather, food and culture of different cities across the world?
Show the class a world map and ask students what they know about the weather, food and culture across the world. Students can draw their responses from personal experience, holiday memories, family discussions etc.
How much hotter will it be in Bangkok tomorrow compared to your local area? How much cooler will it be in Alaska compared to your local area? What temperature difference will there be between your local area and Bangkok? What temperature difference will there be between your local area and Alaska? What would you need to wear in London tomorrow?
Use online resources to show the class the forecasts for weather across the world. Ask students to make predictions about what children in each city would need to wear, eat and do based on the weather forecast for the next day.
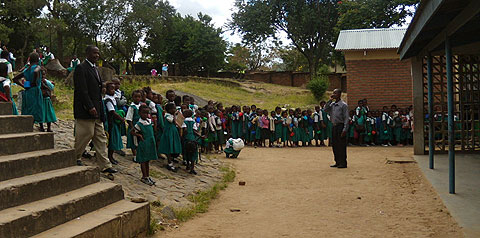
What type of activities do you like that are similar to the activities children in Malawi enjoy?
Provide a photo of your class eating morning tea/recess the previous day and compare it to the photo of children in Malawi lining up for morning tea after school.
Using online resources, you could share more information about the weather, food and culture of Malawi. (It is important that you choose facts and information that are relevant to your class.) Here is a good description of the main meal in Malawi.
Model how to use a Venn diagram. Students could then work in pairs, or as individuals, to create their own Venn diagrams comparing the weather, food and culture of Malawi to their own local area.
To complete the activity, the students could write a brief reflection starting with "If I went to Malawi tomorrow, I would…"
You can download the Weather, food and culture: Teacher notes.
You might want to read the picture book The Boy Who Harnessed the Wind which tells the true story of William Kamkwamba, a 14 year-old boy from Malawi, who made a windmill to produce power for his village. There is also a video of William speaking at a TED talk.
Australian Curriculum links
Year 3
Identify questions or issues for categorical variables. Identify data sources and plan methods of data collection and recording (ACMSP068)
Collect data, organise into categories and create displays using lists, tables, picture graphs and simple column graphs, with and without the use of digital technologies (ACMSP069)
Interpret and compare data displays (ACMSP070)
Year 4
Construct suitable data displays, with and without the use of digital technologies, from given or collected data. Include tables, column graphs and picture graphs where one picture can represent many data values (ACMSP096)
Evaluate the effectiveness of different displays in illustrating data features including variability (ACMSP097)

