Home > Student activities > National Maths Day > National Maths Day 2013 > Lower primary activities > About our world: Weather prediction
About our world: Weather prediction
What will the weather be like in our local area tomorrow?
What will the weather be like in Perth (or other capital cities) tomorrow?
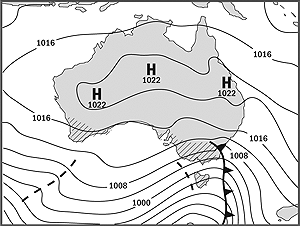
Collect data about the weather from various resources. The Bureau of Meteorology website has forecasts and observations as well as statistics, historical weather observations and information on climate more generally.
The past week's weather data could be collected from the local newspaper and displayed.
Ask students to investigate the data and make predictions about what the weather will be like in different parts of Australia. They can compare their predictions with others in the class.
What would you wear? What activities could you do?
Students use a worksheet to record their predictions of tomorrow’s weather. They decide on appropriate clothing and activities relating to their forecast. On the following day, they can find out how well they did!
You can download the Weather prediction: Student worksheet.
Extension
Students could watch clips of local weather forecasts to assist them in preparing their own weather forecast. Working with a partner they could then present a one minute forecast to the class.
You can download the Weather prediction: Teacher notes.
Australian Curriculum links
Year 3
Collect data, organise into categories and create displays using lists, tables, picture graphs and simple column graphs, with and without the use of digital technologies (ACMSP069)
Interpret and compare data displays (ACMSP070)
Describe possible everyday events and order their chances of occurring (ACMSP092)
Year 4
Identify everyday events where one cannot happen if the other happens (ACMSP093)
Construct suitable data displays, with and without the use of digital technologies, from given or collected data. Include tables, column graphs and picture graphs where one picture can represent many data values (ACMSP096)
Evaluate the effectiveness of different displays in illustrating data features including variability (ACMSP097)

