Media > TDT > Statistics
Screen grab from L5903 Graph investigator: hand preference.Source: © Education Services Australia Ltd, 2011
Screen grab from L5903 Graph investigator: home internet access.Source: © Education Services Australia Ltd, 2011
Grocery market shares.Source: Fairfax Syndication.
Frequencies for categories.Source: © Jane Watson.
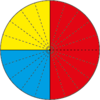
Pie graph created from the frequencies.Source: © Jane Watson.
Using an armspan to measure.
Structure of a box plot.
Dot plot of Australian Prime Ministers' heights.
Mark Taylor's first innings scores.
Graph from Gapminder showing correlation of wealth and lifespan for 200 countries in 2011.Source: Gapminder, Free material available from www.gapminder.org
Screen grab of Maths by email: How much is lots?Source: © CSIRO. Licensed under a Creative-Commons Attribution Licence 3.0 (CC BY 3.0).
Screen grab from Maths by email: thumb wrestling.Source: © CSIRO. Licensed under a Creative-Commons Attribution Licence 3.0 (CC BY 3.0).
Screen grab from Numeracy in the News.
Screen grab from Home Internet survey: topics
Screen grab from Home Internet survey: who?
« Previous 1 2 3
25 50 All